Connect the data at the source
Your platforms feed one place automatically, through their APIs. For Jaffer Business Systems that meant GA4, Search Console, Meta, LinkedIn and YouTube, pulled into a Google Sheet by Apps Script.
Your numbers live in five tools, and someone spends days a month stitching them together. I connect them once, so the dashboard keeps itself up to date. It starts with a look at how your reporting works today.
Book a consultationExport from GA4. Export from Search Console. Export from Meta, from the ad account, from the email tool. Paste it into a spreadsheet, fix the dates, upload it, rebuild the charts. By the time it is finished, the month has moved on and the numbers are already old.
It is the same in an online store and in a B2B company. Several channels, often several markets, and one question the people in charge actually want answered: where should the next budget go.
Your platforms feed one place automatically, through their APIs. For Jaffer Business Systems that meant GA4, Search Console, Meta, LinkedIn and YouTube, pulled into a Google Sheet by Apps Script.
It runs without anyone at a computer, and the API keys stay private. It does not wait for the end of the month, so the numbers in a Monday meeting are this week's numbers.
Which KPIs, trends and charts belong on the screen, by channel and by market. A dashboard with forty charts is a report nobody reads.
Where you are losing attention, where you are ready to scale, and what to do next, ranked by impact. The same data, turned into an action plan.
Any task that copies data from one tool to another by hand, every week or every month, is a candidate. If your team dreads it, it is worth a look.
When I joined the marketing team, the monthly dashboard took days. The team exported data from LinkedIn, GA4, Search Console, Meta and YouTube, compiled it in Excel and uploaded it to Power BI, for six business units.
I replaced that with a dashboard that pulls the data on its own and never goes out of date. Then I used the same data to build a diagnostic for leadership, with ten moves ranked by impact. Both are live.
I also connected Claude to the team's GoHighLevel CRM, so new leads are qualified and follow-ups are drafted without anyone starting from a blank page.
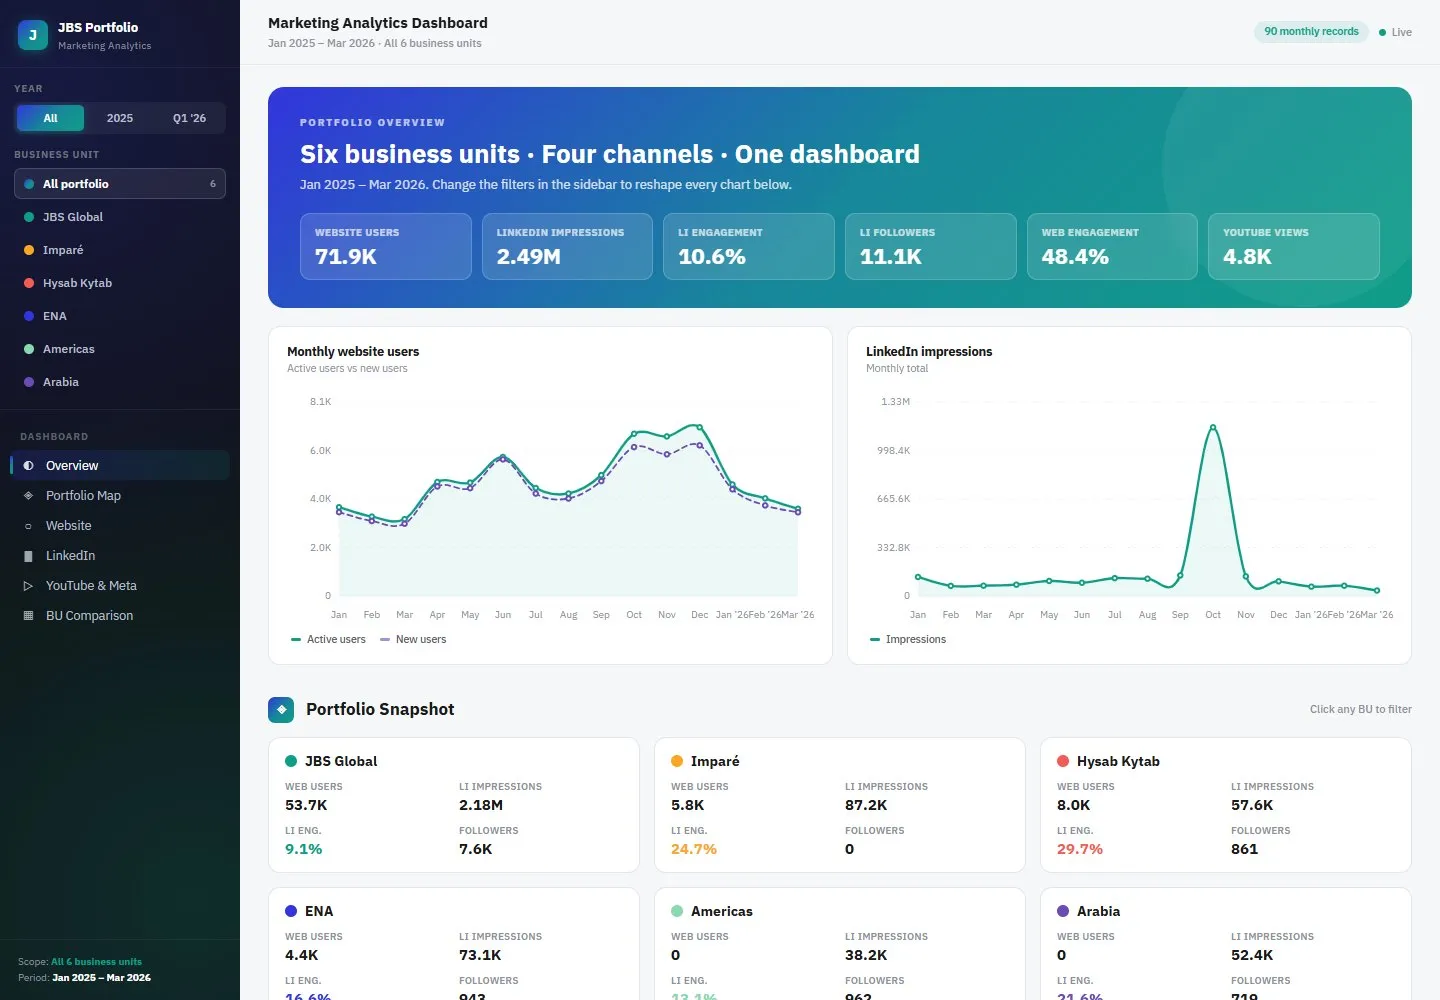
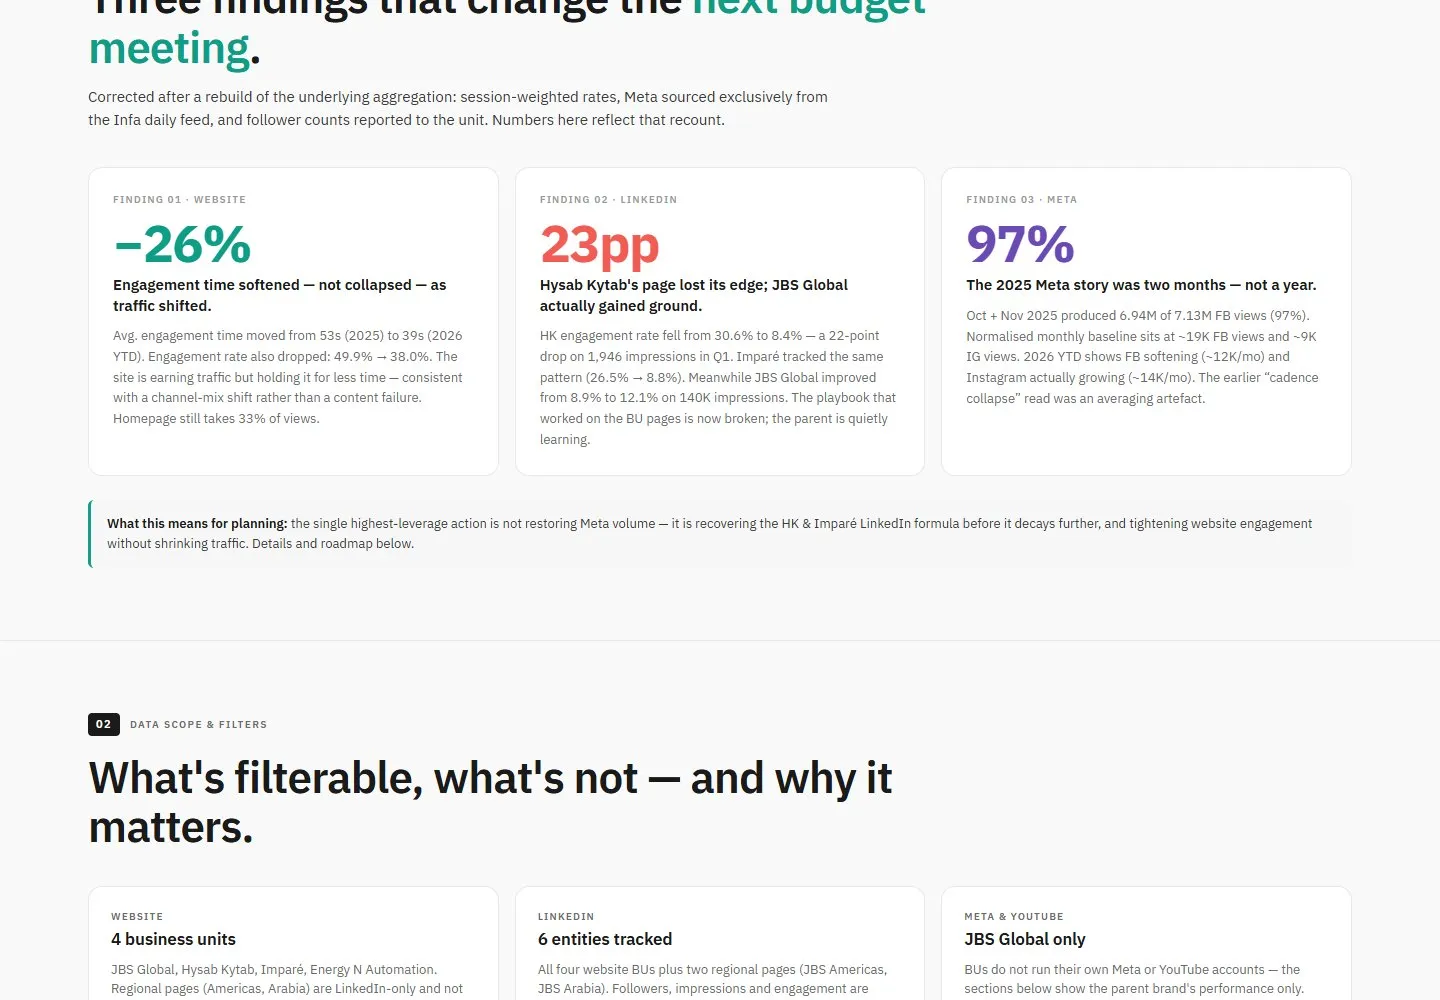
A dashboard is only as good as the questions it answers. For a B2B portfolio that is which business unit and which channel is earning attention. For a fashion brand it is which line is carrying the season, which market is worth the shipping and the duty, and which channel finds new customers rather than the same ones again.
Connecting APIs is the technical half. Knowing what the screen should show the person deciding the budget on a Monday morning is the other half, and it is the one most dashboards skip.
Which tools hold your numbers, how the team reports today, how long it takes, and which decisions the report is supposed to support.
The APIs wired up and the data flowing in automatically, checked against what each platform shows on its own.
The dashboard itself, built around your channels and markets, and the diagnosis that turns it into next steps.
A walkthrough for the team, so everyone knows what each number means. I keep it running if you want me to.
So far I have connected GA4, Search Console, Meta, LinkedIn and YouTube for reporting, and GoHighLevel with Claude for leads and follow-ups. I build all of it with Claude Code. Most platforms that hold marketing data have an API. Tell me what you use and I will tell you on the call what can be connected.
No. I build it and set it up. I build with Claude Code, which is how I connected the APIs, Apps Script, GitHub and Cloudflare for the Jaffer Business Systems dashboard.
If I run your SEO or Google Ads, reporting on that work is part of the job. This service is for the whole picture: every channel and every market on one screen, without anyone compiling it.
Usually, yes. The dashboard tool is rarely the problem. The problem is the days spent getting the data into it. That is the part I automate.
List the tools and how your team reports today. I will tell you what can run on its own.
Book a consultationI use Google Analytics to see which pages are useful. Is that all right?